Portfolio
-

StoryMap
A digital storytelling tool that combines maps, narrative text, images, and multimedia to present complex information in an engaging, interactive format. It allows users to explore spatial data while following a cohesive story. In this project, titled “Eaton Fire and the Impact on the Altadena Community,” I use a StoryMap to document the devastating effects of the Eaton Fire on Altadena’s environment, residents, and infrastructure.
-
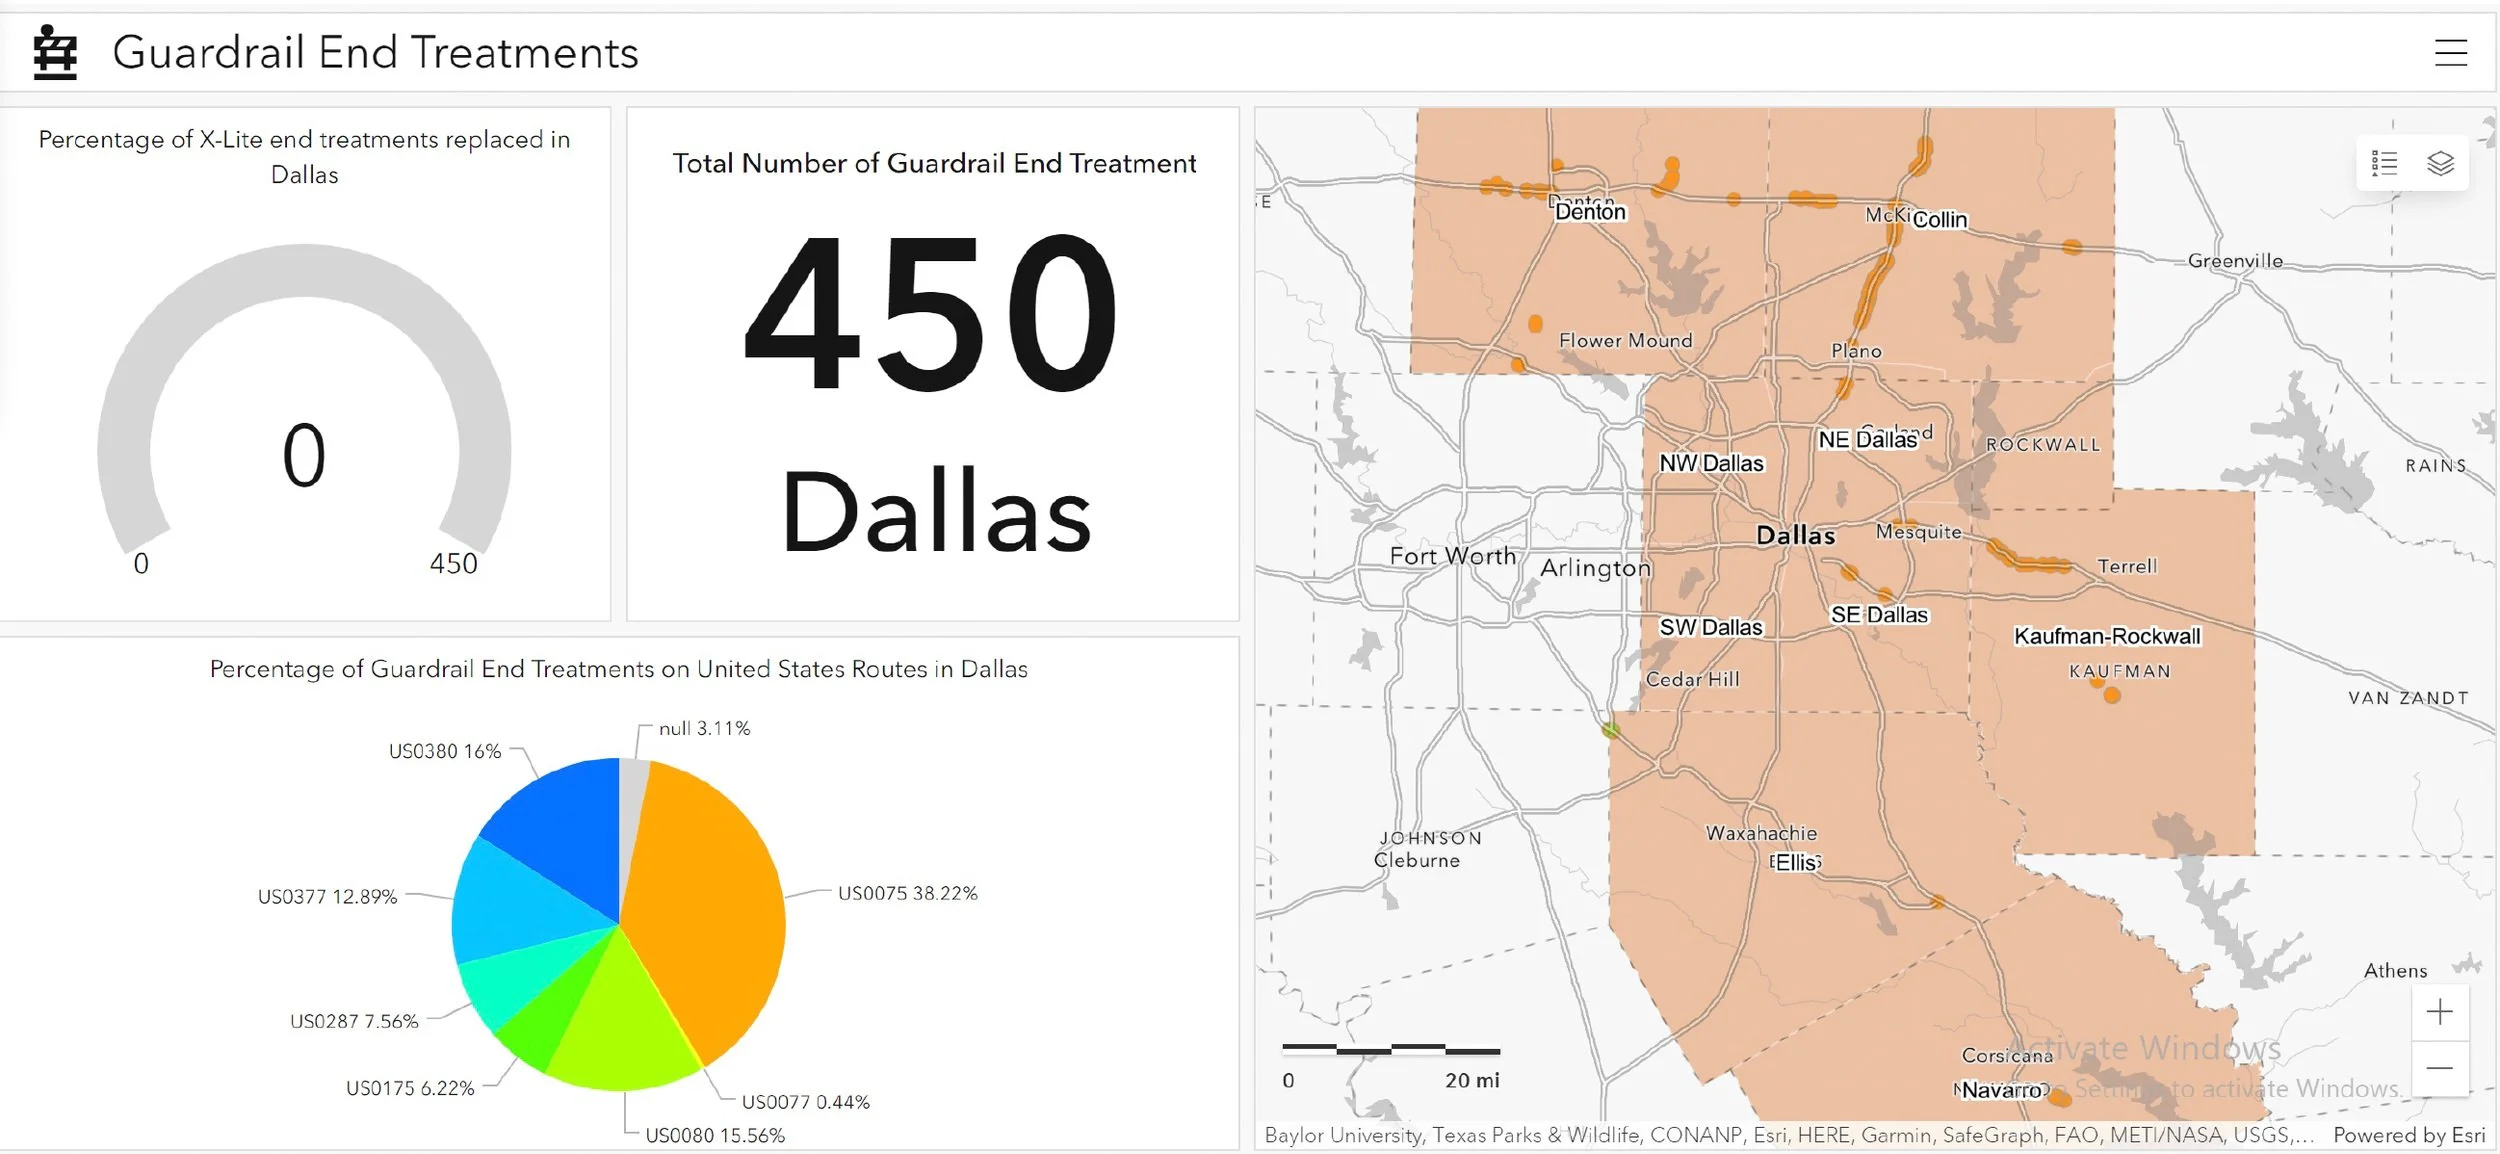
Dashboard
A dashboard in ArcGIS Online is an interactive interface that integrates maps, charts, and other visualizations to provide a comprehensive, real-time view of geographic data and key metrics. This dashboard displays the status of replaced guardrails end treatments on an indicator with a pie chart demonstrating the guardrails along the US routes, gauge of replacement status, and a web map in Dallas.
-

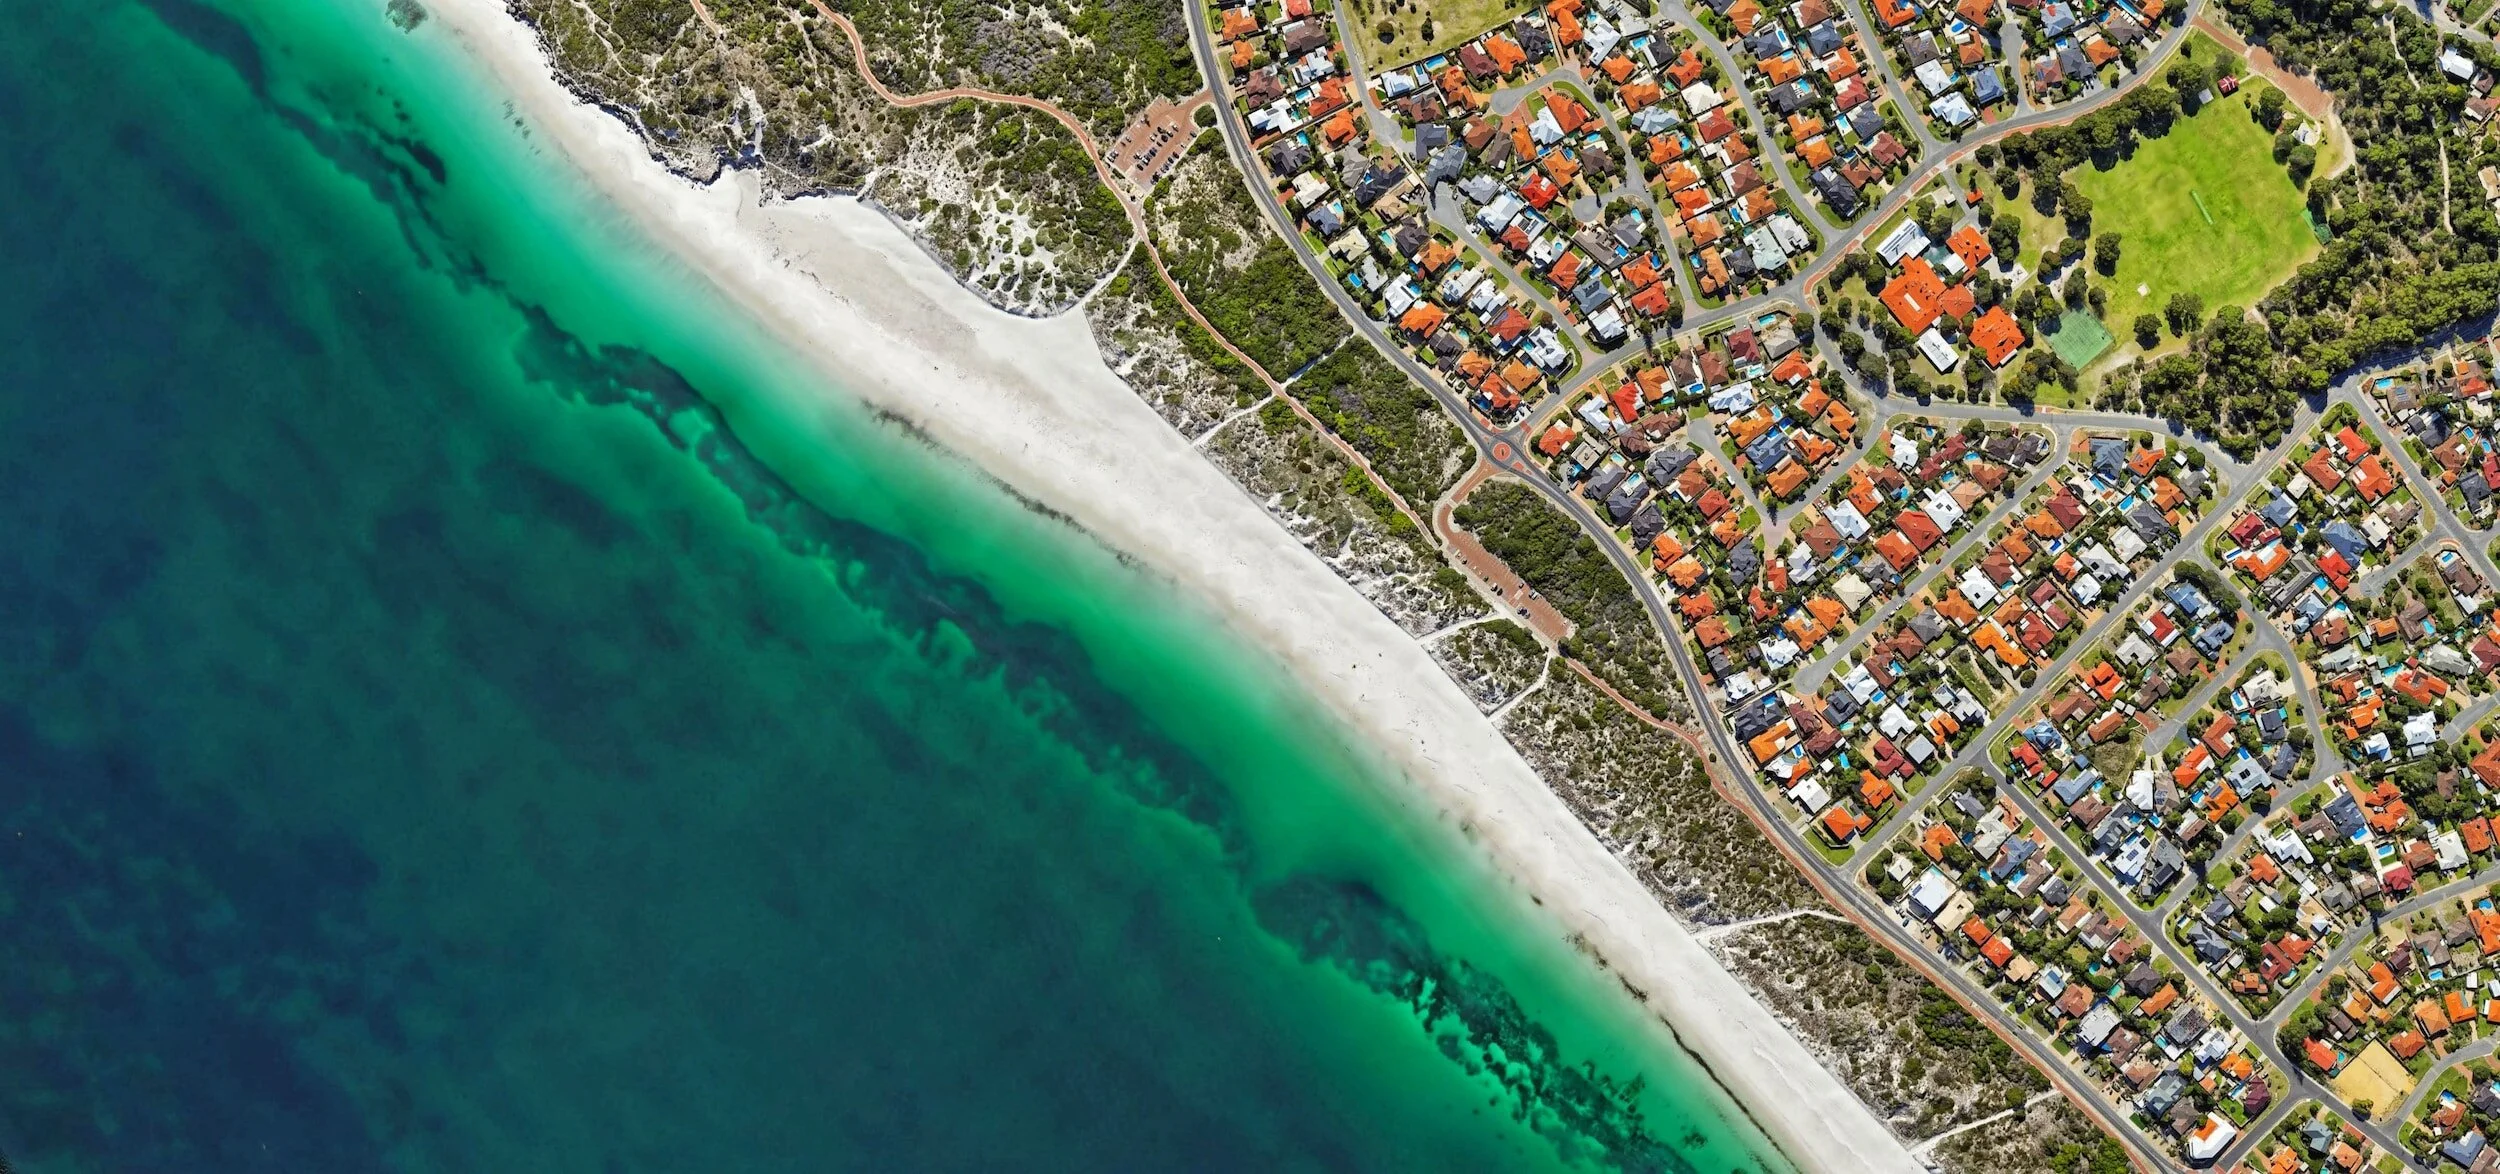
Supervised Image Classification
Supervised image classification is a process in which a computer system is trained to categorize images into predefined classes based on labeled training data. At Richard’s Property at Yale University, I classified features of the landscape to distinguish land covers of forest, crops, and salt marshes using ENVI software.
-

Field Application
A field application is a mobile or tablet-based tool designed to collect, update, and manage geographic data in real-time while out in the field often using ArcGIS Field Maps or Survey123. This field application records lightning strikes in Arizona.
-
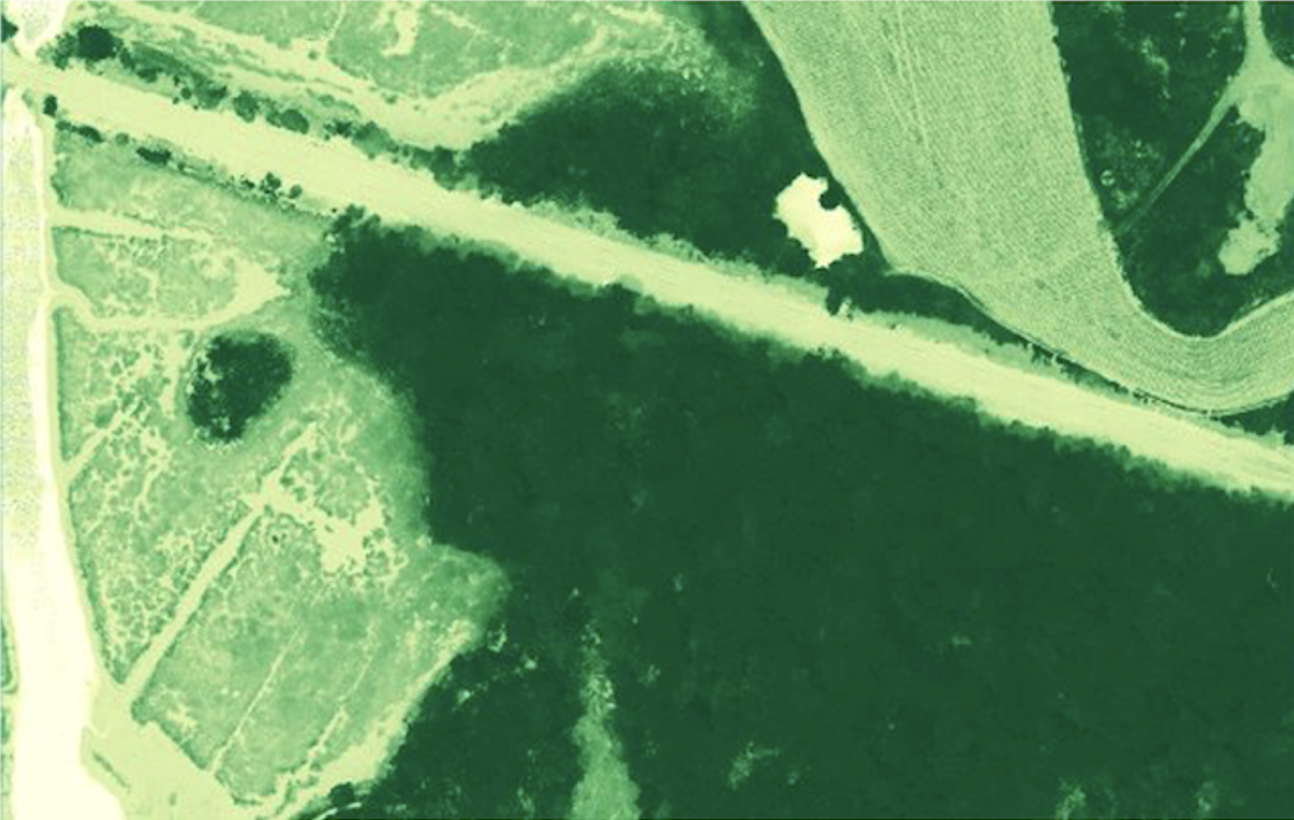
NDVI using Red and Red Edge
The Normalized Difference Vegetation Index (NDVI) assesses vegetation health and density by analyzing reflectance in the visible (red) and near-infrared (NIR) light spectra. The formula for NDVI is:
NDVI = (NIR−Red) / (NIR+Red)
-
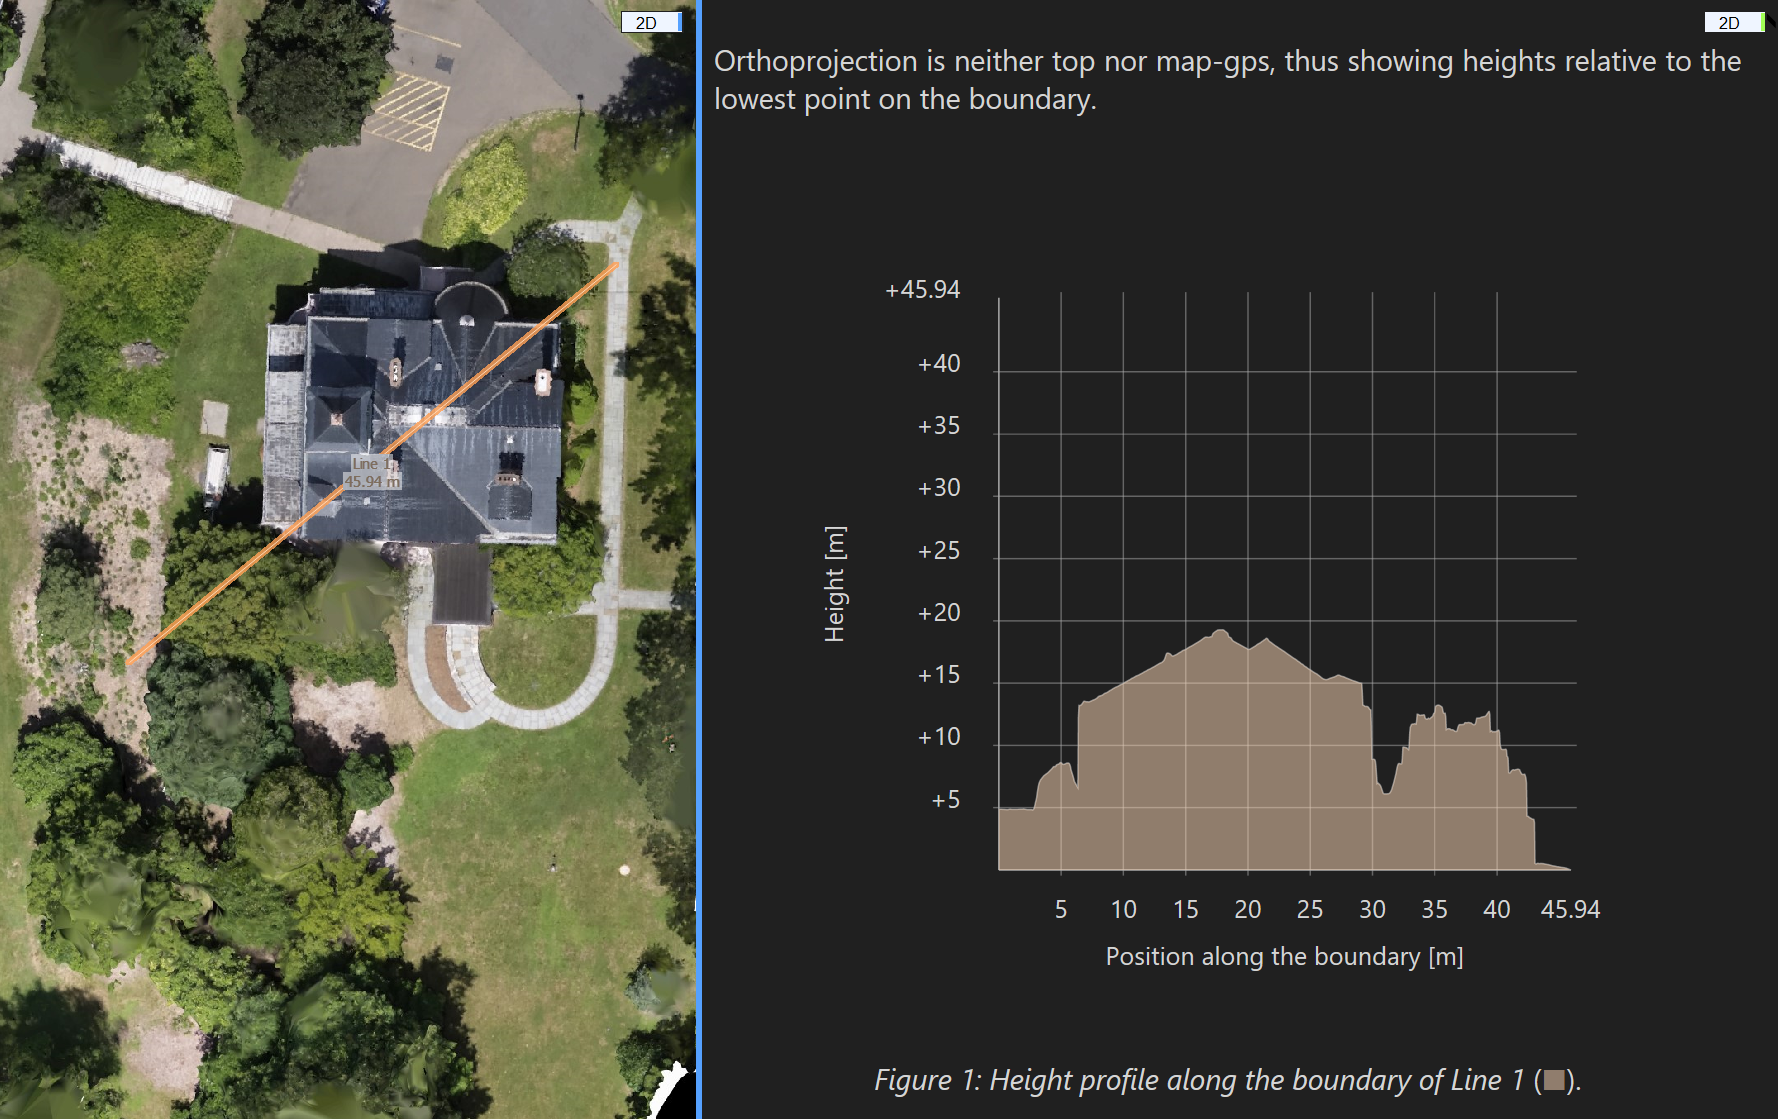
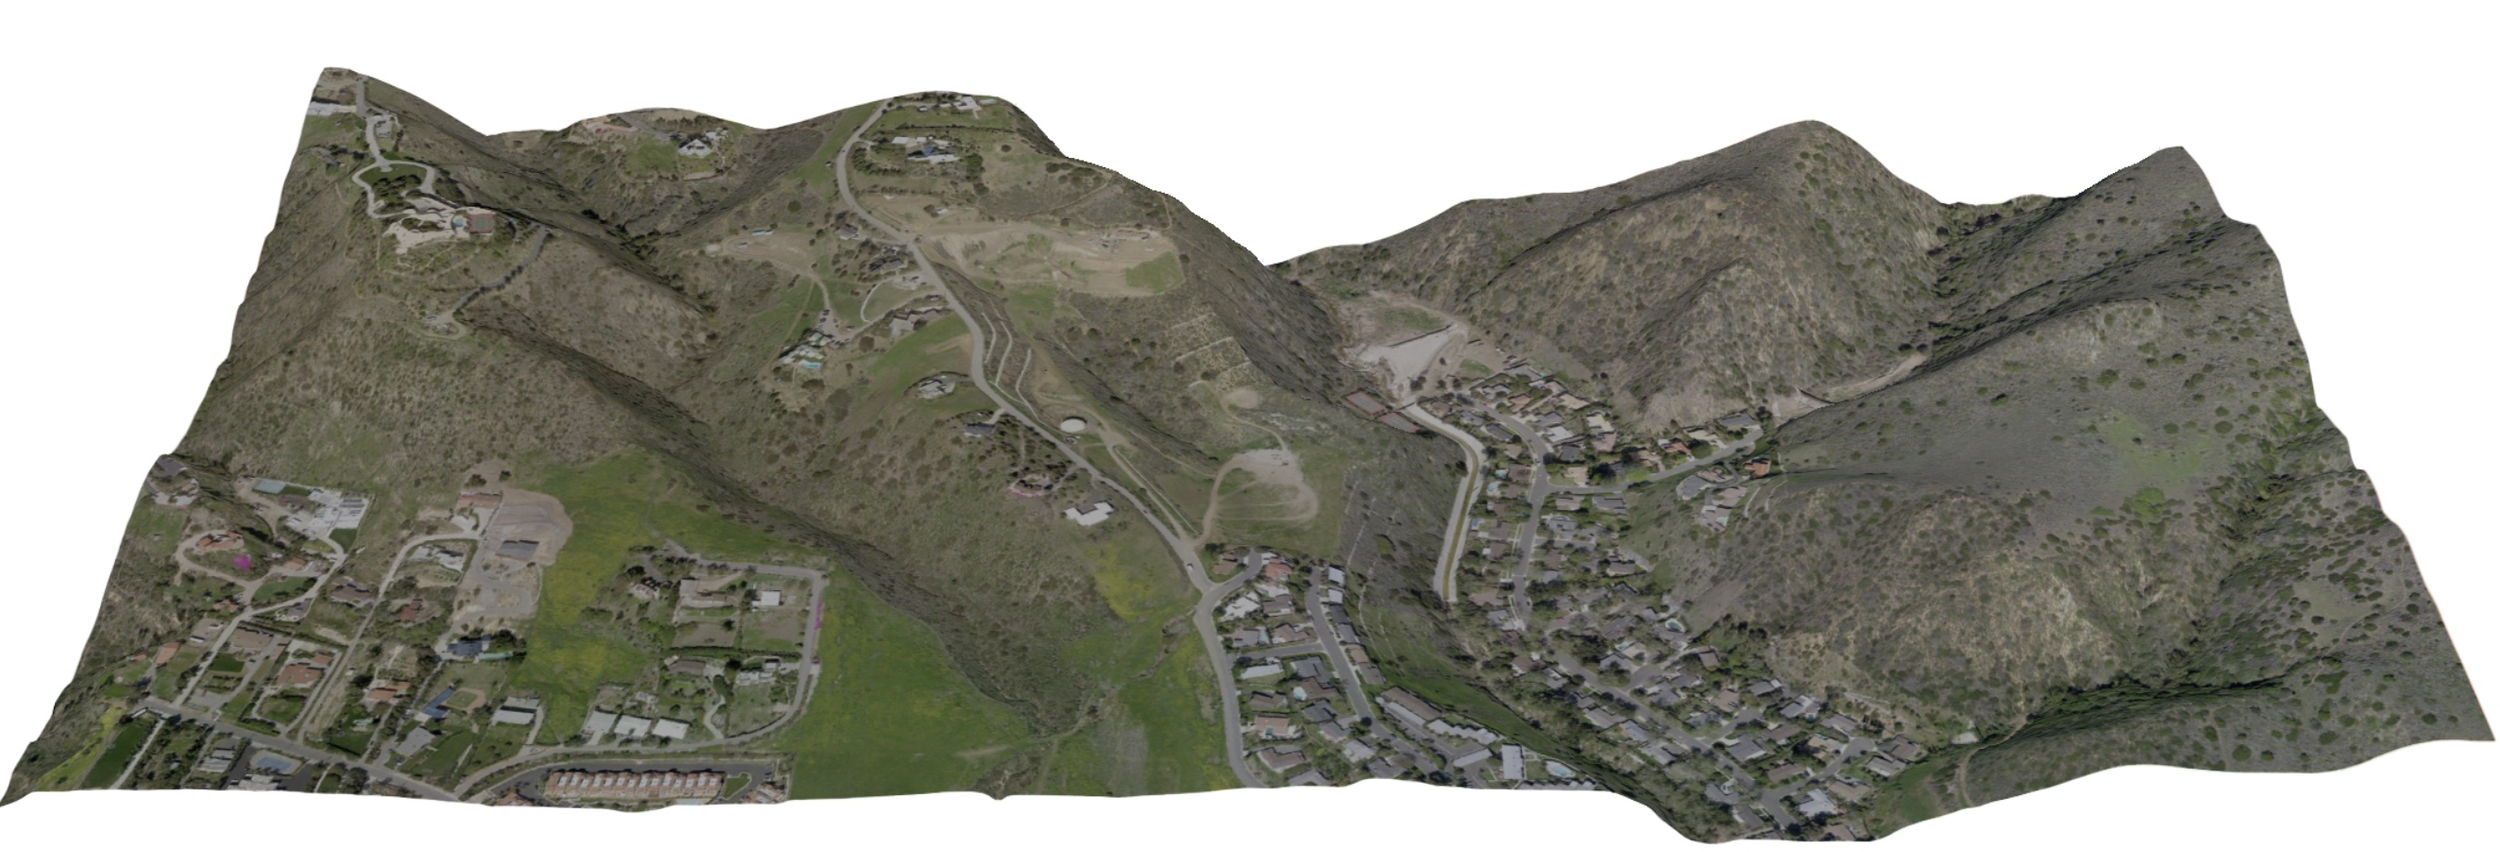
Height Profile
Height profile analysis involves measuring the vertical dimensions of objects captured in raster data such as 3D models generated from drone imagery. This analysis helps in understanding the spatial distribution and structural characteristics of features within the landscape.
-
Deriving Surfaces from CAD
Deriving surfaces from CAD involves converting CAD (Computer-Aided Design) data into 3D terrain models or surface representations for use in GIS applications, enabling detailed spatial analysis and visualization.
-

Working with CAD
The transform tool is utilized to align a CAD file with a specific coordinate system or reference points. This tool allows you to select points on the CAD file and corresponding points on a basemap, enabling you to accurately position and scale the CAD data within the GIS environment. This process ensures that the CAD file aligns correctly with other geographic data layers for accurate mapping and analysis. I aligned a CAD file to the Rio Hondo College campus basemap.
-

Band Combinations
Band combination is where different spectral bands (channels) from multispectral images are combined to enhance certain features of the image. Each band corresponds to a specific wavelength range of the electromagnetic spectrum, and by combining these bands in various ways, specific characteristics of the Earth's surface or objects can be highlighted. I compared true color image (321RGB) using JPG photos to false color composite (431RGB) using multispectral photos.
-

Annotation
Annotation using GIS involves creating and managing text labels or symbols on a map to provide additional information or context, such as place names, building labels, or other descriptive details, which can be customized in terms of font, size, and placement for clarity and readability. I annotated to display the council district members and neighborhoods in the City of Riverside.
-

Georeference & Digitize
Georeferencing is the process of aligning images to real-world coordinates by assigning spatial reference information, ensuring the data accurately reflects its geographic location on the map. Digitizing converts physical maps or images into digital format by tracing features like boundaries or roads, creating vector layers that can be analyzed and edited. Within Los Angeles County, I georeferenced and digitized parcel maps.
-

Map Elements
Map elements are components of a map that enhance its readability and functionality, including the title, legend, scale bar, north arrow, map projection, and metadata, which together provide context, orientation, and interpretive information to help users understand the map's content and purpose. I designed a map to demonstrate the Hispanic population per county in California in the year 2018 in a graduated color symbology.
-

Digitial Illustration Design
Graphic Design is visual communication combined with art and technology to convey information. In Adobe Illustrator, I combined color theory, elements of art, and principles of design to create visually appealing designs.
-
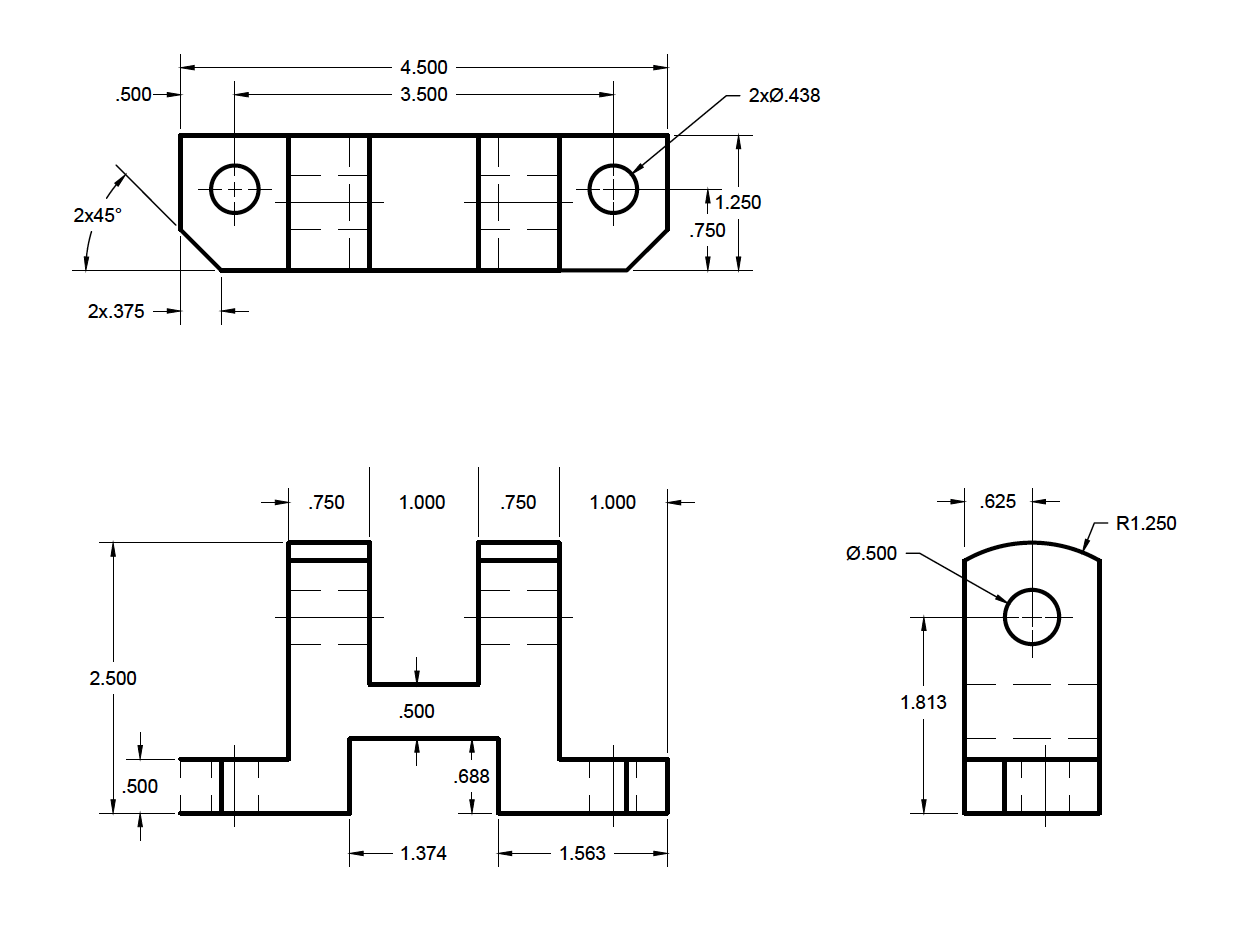
AutoCAD Designs
AutoCAD is a computer-aided design (CAD) software used to create precise 2D drawings and 3D models for planning, design, and documentation. It is widely used in architecture, engineering, construction, manufacturing, and interior design to draft floor plans, technical schematics, site layouts, and detailed construction documents. AutoCAD helps users visualize designs, ensure accuracy, and efficiently communicate ideas through standardized, professional drawings.